
Should you use Power BI on its own or with Excel?
 Ken Puls, FCPA, FCMA, likes Excel’s ability to do ad-hoc modelling, while CPA Sophie Marchand, likes the fact that key tools such as Power Query and Power Pivot are built into Power BI (Shutterstock/Rawpixel.com)
While some users (such as CPA Sophie Marchand, a consultant who specializes in training) like to use Power BI from start to finish, others (such as Ken Puls, FCPA, FCMA, president and CTO of Excelguru Consulting Inc.) prefer to do most of their work and data preparation inside Excel before moving to Power BI. Here’s why.
Excel-Power BI combo
Puls likes Excel’s ability to do ad-hoc modelling. “One of the reasons Excel is so successful is people can open it up and do anything, anywhere, anytime,” he says. “Say you have 17 cells in various places and you want to bring them together to create a highly customized dashboard report with fields laid out in a very specific way. You can use the Excel worksheet grid to do that, laying out your data however you want. Power BI doesn’t have a worksheet grid that allows you quite the same flexibility. It is built to work from very structured tables using their defined visuals.
“Personally, I usually do all my modelling in Excel, as it gives me the ability to work with the structured data tools in Power Query and Power Pivot, but also allows me to do ad-hoc reporting, data validation and testing in a non-structured way,” he adds. “When I’m satisfied that the data is clean and reliable, I’ll publish the result to power BI so that I can use the tool where it really shines—in the visualization and the sharing and control layers.”
Power BI all the way
Marchand likes the fact that key tools such as Power Query and Power Pivot are built into Power BI. This makes the software more stable and unified than the equivalent tools in Excel, she says.
She adds that Power BI includes security roles that do not exist in Excel. For example, it lets you create filters for data from different managers. When connecting to the dashboard, each manager would be able to see only the data that relates to them.
Marchand stresses that she is not against using Power Query and Power Pivot in Excel: “When the end result is something I want to create in Excel—such as an invoice for clients—I do all the work inside Excel, using Power Query and so on. But if I want to build a dashboard, I will use Power BI Desktop and the Power BI web portal. It all depends on what I am trying to create.”
 (Image provided)
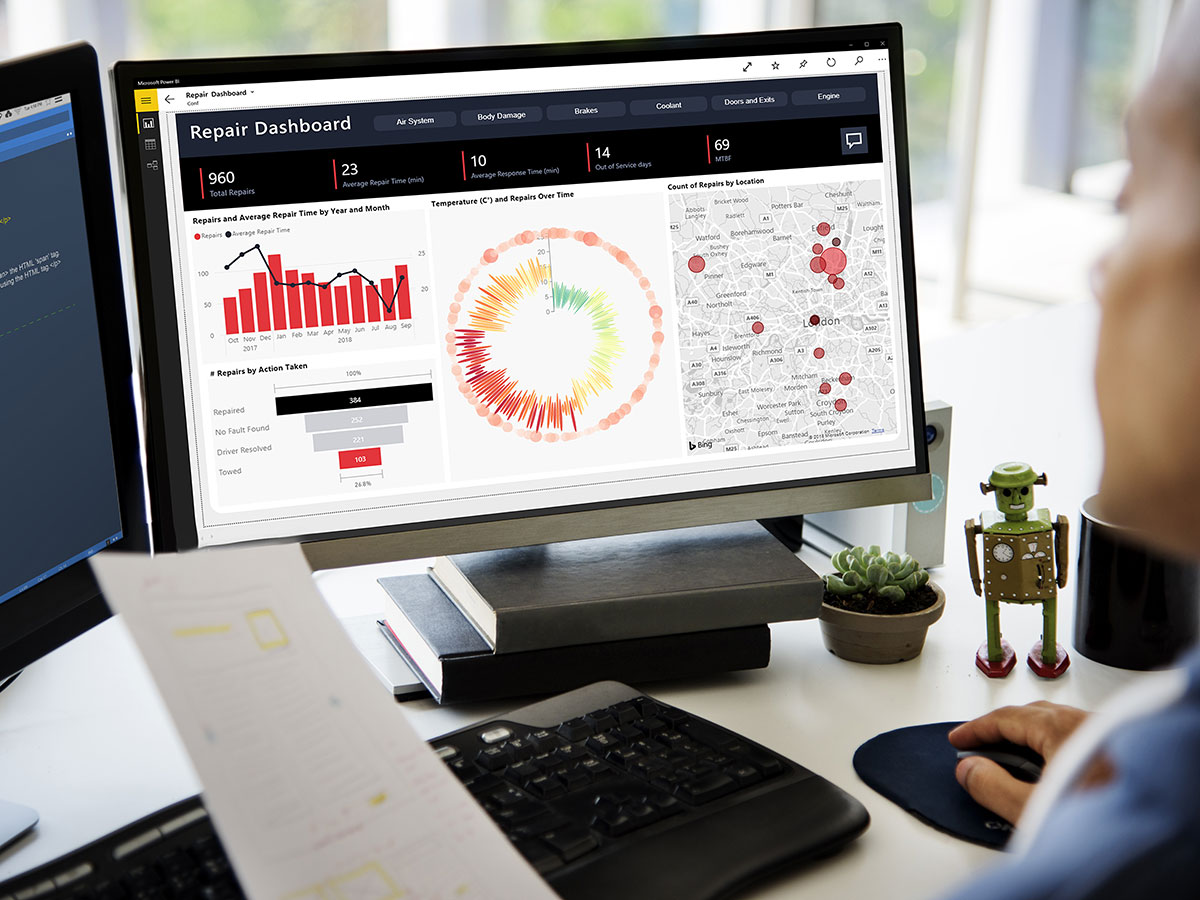
Flight analysis: Ken Puls created this report in Excel and Power BI to show where he has flown this year how his flight activity is growing year over year, and so on. (It is drilled to 2019.) “The chart in the bottom right is especially important to me, because it shows how close I am to hitting each of Air Canada’s loyalty tiers by month. The yellow line at 50K gives me guaranteed access to any Star Alliance lounge worldwide, while moving up to the 75K and 100K plans gives me a few more perks to make travel a little easier overall.”
 (Image provided)
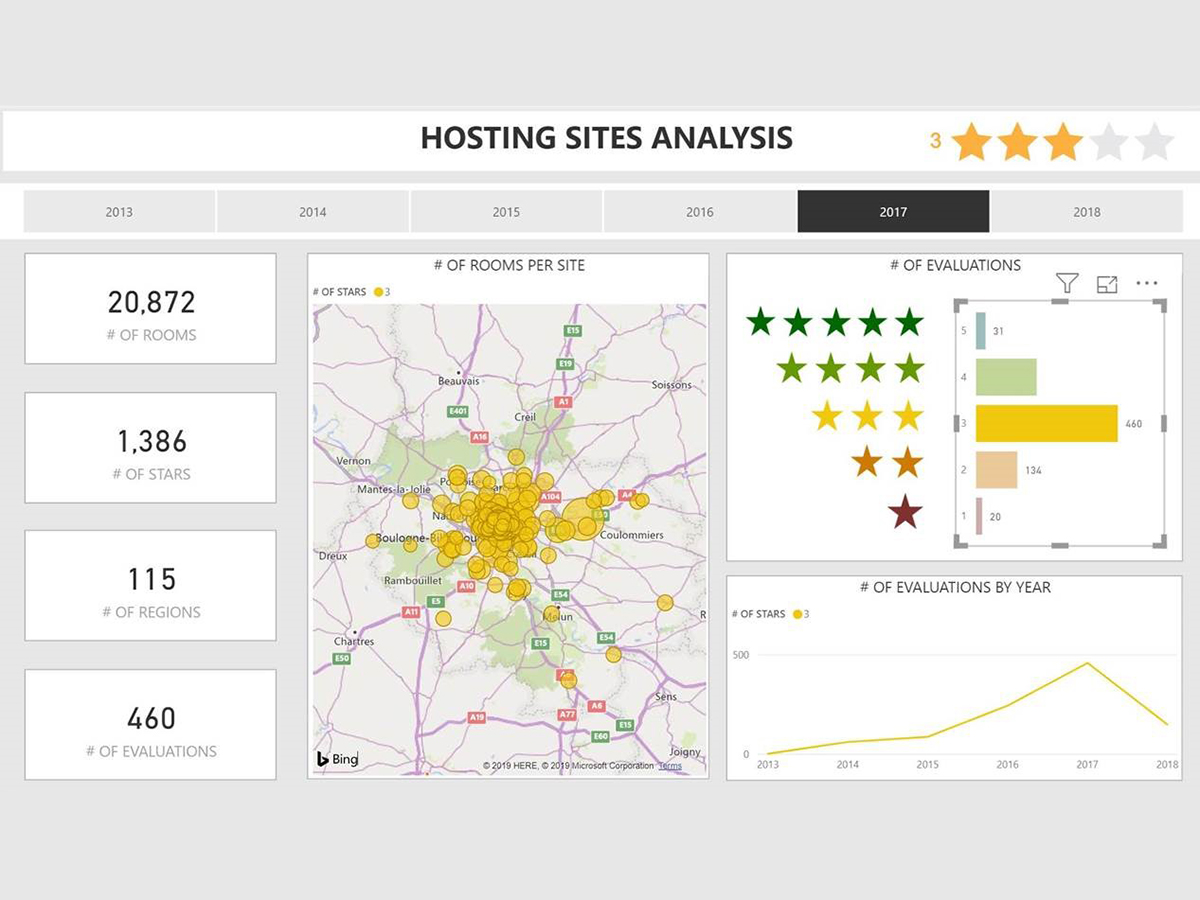
Hosting site analysis: In this report, which Sophie Marchand created for her Power BI workshops, she shows hosting sites by location, number of reviews, stars and so on, for a particular region.